Dashboard
The Dashboard page provides key analytics and performance metrics for your AI agents and live agent engagements. It offers a visual overview of session volumes, transfer rates, and agent efficiency, helping you understand user interaction patterns and operational performance.
Prerequisites
Before you can view the Dashboard, ensure the following conditions are met:
- You must be logged into the application.
- Your user role must have the necessary permissions (
owner,admin, oragent). - You must have an Account selected from the sidebar.
Page Overview
The Dashboard is an interactive page with several filtering options at the top that control the data displayed in the charts.
Filters
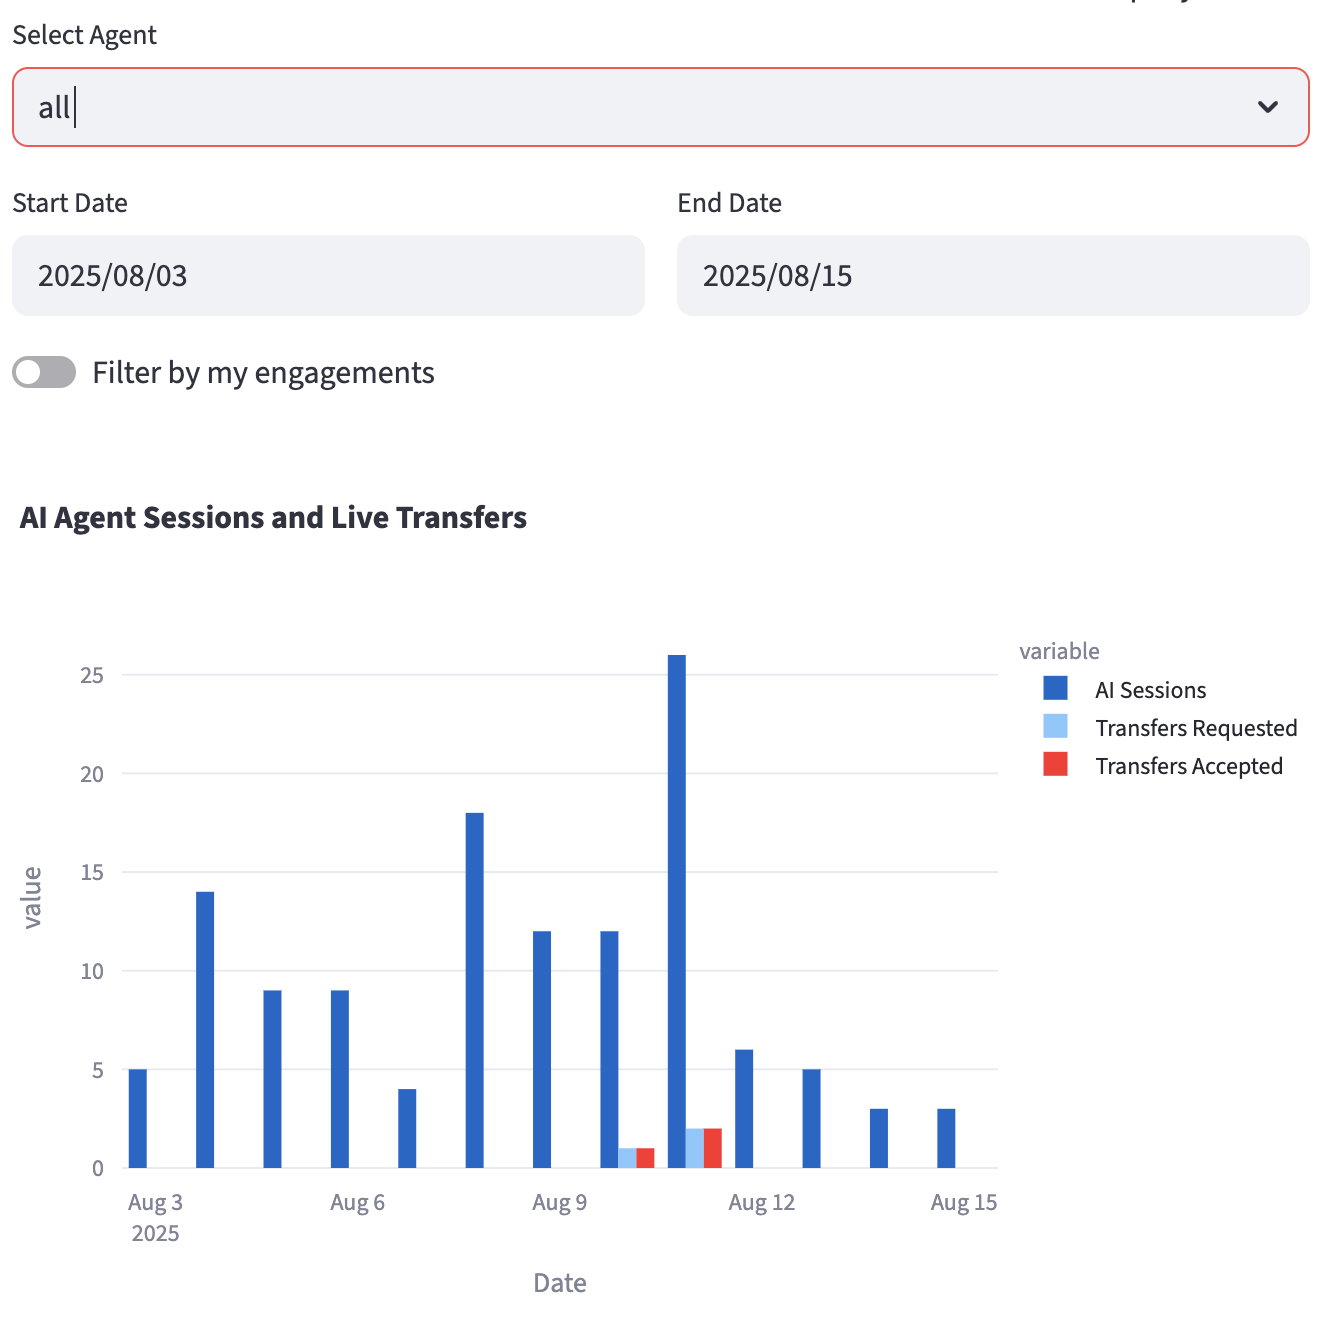
- Select Agent: A dropdown menu to filter the dashboard data for a specific AI agent. You can also select "all" to view aggregated data for all agents within the selected account.
- Date Range: Two date pickers, "Start Date" and "End Date", allow you to define the time period for the analytics. The default range is the last 7 days.
- Filter by my engagements: A toggle switch that, when enabled, filters the "Engagement Duration" chart to show only the live agent engagements handled by you (the currently logged-in user).

Charts and Metrics
The dashboard features several charts to help you visualize performance.
1. AI Agent Sessions and Live Transfers
This grouped bar chart provides a daily breakdown of user interactions over the selected date range.
- AI Sessions: The total number of distinct AI agent conversation sessions initiated each day. This helps you understand the overall traffic and user engagement with your AI agents.
- Transfers Requested: The number of AI sessions where the user requested a transfer to a live agent. This metric is a key indicator of when and why users need to escalate from the AI.
- Transfers Accepted: The number of requested transfers that were successfully picked up by a live agent.
How to Interpret:
A large gap between "Transfers Requested" and "Transfers Accepted" might indicate:
- Insufficient live agent staffing.
- Users abandoning the chat while waiting for an agent.
- Issues with your live agent routing or availability.
2. Time from Request to Engagement (in seconds)
This histogram shows the distribution of wait times for users who requested a transfer. It measures the time from the moment a user requests a live agent to the moment an agent accepts the engagement.
How to Interpret:
- A distribution skewed to the left (shorter times) indicates high efficiency and good customer service.
- A wide distribution or a skew to the right (longer times) suggests that users are waiting too long for assistance, which can lead to frustration and abandonment. This could be a signal to review agent staffing levels or routing rules.
3. Engagement Duration Distribution (minutes)
This histogram displays the distribution of the total time spent by live agents on completed engagements.
How to Interpret:
- This chart helps you understand the complexity of the issues being handled by live agents.
- A high frequency of short-duration chats might indicate simple queries that the AI could potentially handle.
- A high frequency of long-duration chats could point to complex problems, a need for better agent tools, or opportunities for more targeted AI-powered agent assistance.
By analyzing these charts together, you can gain valuable insights into your customer support operations, identify bottlenecks, and find opportunities to improve both your AI agent's effectiveness and your live agents' efficiency.
Data Source
This page queries sessions and engagements to aggregate and visualize the data.