Intent Visualizer
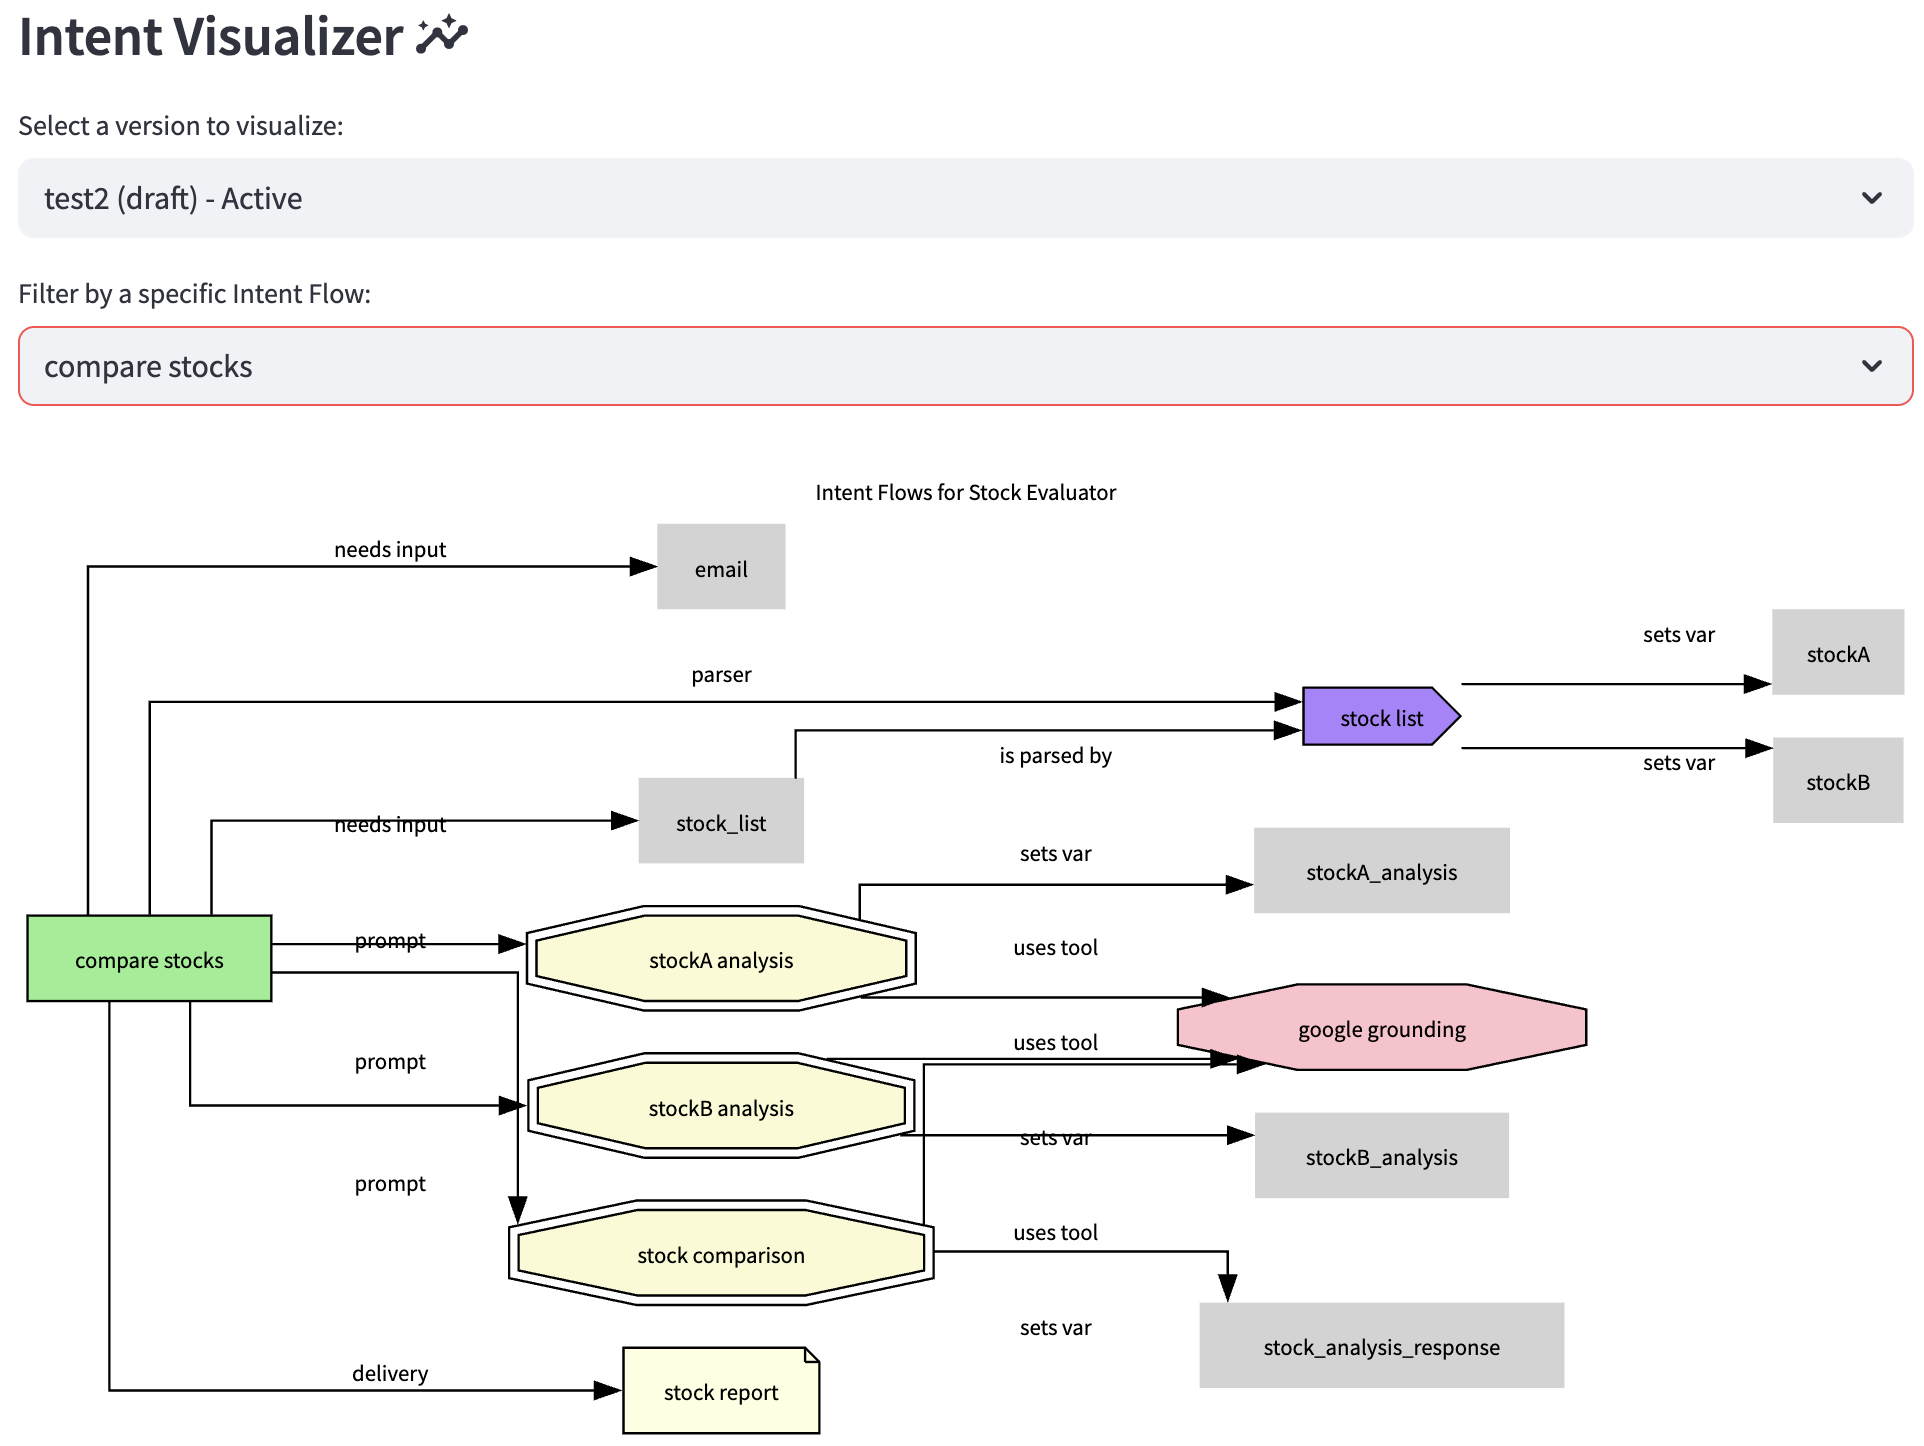
The Intent Visualizer is a powerful diagnostic tool that renders a graphical representation of your agent's configuration flow. It helps you understand the relationships and dependencies between different components like intents, prompts, APIs, and variables. This is particularly useful for debugging complex logic, onboarding new team members, and documenting your agent's architecture.
The visualization is based on a specific, saved Version of an agent, allowing you to analyze and compare different configurations over time.
Prerequisites
Before you can use the visualizer, ensure the following conditions are met:
- You must be logged into the application.
- Your user role must have the necessary permissions (
owner,admin,editor, orversions). - You must have an Account and an Agent selected from the sidebar.
- The selected agent must have at least one saved Version (created on the Versions page).

How to Use the Visualizer
The page is straightforward to use and involves two main steps.
Step 1: Select a Version
Use the first dropdown menu, "Select a version to visualize:", to choose which saved version of the agent you want to inspect. The versions are listed by name, type, and status (active/inactive).
Step 2: Select an Intent Flow
Once a version is selected, a second dropdown appears: "Filter by Intent Flow:". This allows you to control the scope of the visualization.
-
Starting Flow (Default): This view shows the agent's main entry points. It visualizes the
startPrompt(used for initial user input classification) and thedefaultIntent(the fallback intent when no other match is found) and their immediate connections. This is useful for understanding how a conversation begins. -
Specific Intent Flow: Selecting any other intent from this list will generate a graph focused exclusively on that intent's complete execution path. It will show every component that the selected intent calls, either directly or indirectly, giving you a clear picture of its entire logic from start to finish.
The graph will automatically update based on your selections.
Understanding the Graph
The generated diagram uses different shapes and colors to represent the various components of your agent's configuration. The arrows (edges) show the direction of the flow or the relationship between components, and they are often labeled to describe the nature of the interaction (e.g., "uses tool", "sets var").
Node Legend
| Shape | Color | Node Type | Description |
|---|---|---|---|
| ● | Light Blue | Agent | The root agent node (only in "Starting Flow" view). |
| ■ | Light Green | Intent | Represents a user's goal or purpose. The central organizing component. |
| ■ | Cyan | Action | A reusable block of logic, often called by an intent. |
| डबल | Light Goldenrod | Prompt | A template used to query the LLM for a response or classification. |
| ⬄ | Magenta | MCP | A Multi-turn Conversation Processor for complex, stateful tasks. |
| ⬢ | Pink | Tool | An external function or pre-built capability (e.g., Google Search). |
| ➤ | Light Coral | API | A connection to an external RESTful API. |
| ⬅ | Orange | Connector | A configuration for authenticating with external services (e.g., OAuth). |
| 🗀 | Khaki | File | A file read/write operation (GCS, S3, local). |
| 🗎 | Light Yellow | Delivery | A method for sending information out (e.g., email, SMS). |
| ⌂ | Tan | Script | A custom script (e.g., JavaScript) to be executed. |
| cds | Medium Purple | Parser | A tool to extract data from a source variable into other variables. |
| ⬬ | Medium Purple | Merger | A tool to combine data from variables into a new output. |
| Variable | Light Grey (no border) | Variable | A piece of data stored in the agent's session state. |
Common Use Cases
- Debugging: Trace the exact path of a failing intent to identify the problematic component.
- Optimization: Identify redundant API calls or overly complex prompt chains.
- Collaboration: Quickly show a colleague how a specific feature is implemented.
- Impact Analysis: See which intents will be affected if you change a shared prompt or API configuration.